Oil vs Bitcoin During Iran War Tension: Side-by-Side Chart Review and What Traders Watch
The simple frame is this: oil reacts first to supply disruption risk, bitcoin reacts to changing risk mood, dollar strength, and forced selling. Sometimes bitcoin also trades like a "panic hedge," but it's not consistent.
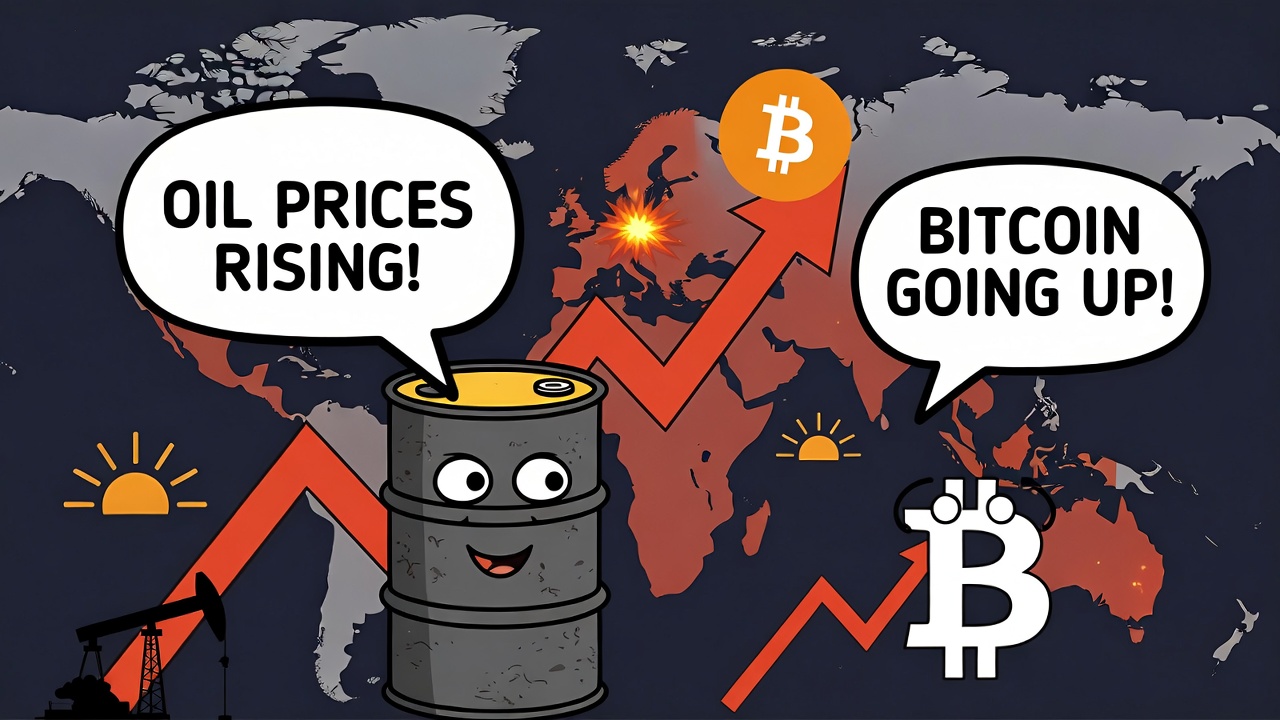
When war headlines hit, markets don't wait for perfect information. In early March 2026, Iran war tension ramped up fast after U.S. and Israeli strikes, followed by regional retaliation and threats to shipping through the Strait of Hormuz. That matters because crude oil is a physical supply trade, while bitcoin is mostly a risk and liquidity trade that can swing both ways.
The simple frame is this: oil reacts first to supply disruption risk, bitcoin reacts to changing risk mood, dollar strength, and forced selling. Sometimes bitcoin also trades like a "panic hedge," but it's not consistent.
Below is a side-by-side chart walkthrough (what to look for on each chart) and a practical checklist traders watch over the next 24 to 72 hours.
Side-by-side chart review, what oil usually does vs what bitcoin often does
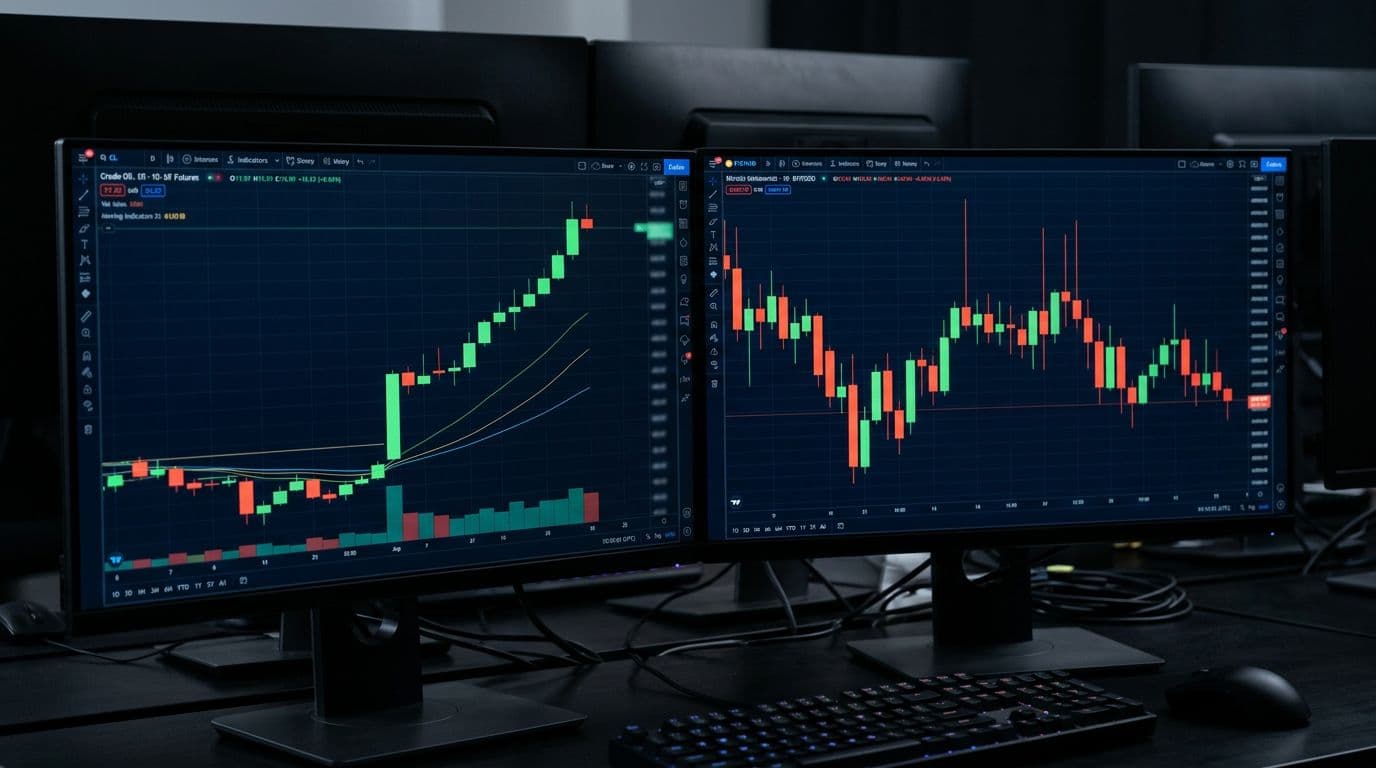 Side-by-side oil and bitcoin volatility on candlestick charts, created with AI.
During war-driven news, both markets can print dramatic candles, but they often "say" different things. Oil's chart tends to move like a supply shock meter. Bitcoin's chart tends to move like a global positioning meter.
Here's a quick way to read them side by side:
| What you see on the chart | Oil (WTI/Brent) often implies | Bitcoin often implies |
|---|---|---|
| Sudden upside gap or vertical spike | Supply fear, shipping risk, insurance stress | Either panic bid or short squeeze, often fades |
| Big wick after a headline candle | Traders took profit fast, risk may be overstated | Whipsaw positioning, liquidations both ways |
| Rising volume on a breakout | Real participation, not just a headline pop | Could be real demand, or forced buying in thin liquidity |
| Tight range after chaos | Market waits for shipping clarity | Market waits for dollar and rates direction |
A useful mindset is to treat oil as the "front page" of the war trade and bitcoin as the "sentiment page." That difference shows up in support and resistance behavior. Oil often breaks out and holds if the physical story stays uncertain. Bitcoin often breaks out, then tests the move quickly, because liquidity and risk appetite can flip in hours.
Oil chart tells a supply story first (Strait risk, shipping halts, headline spikes)
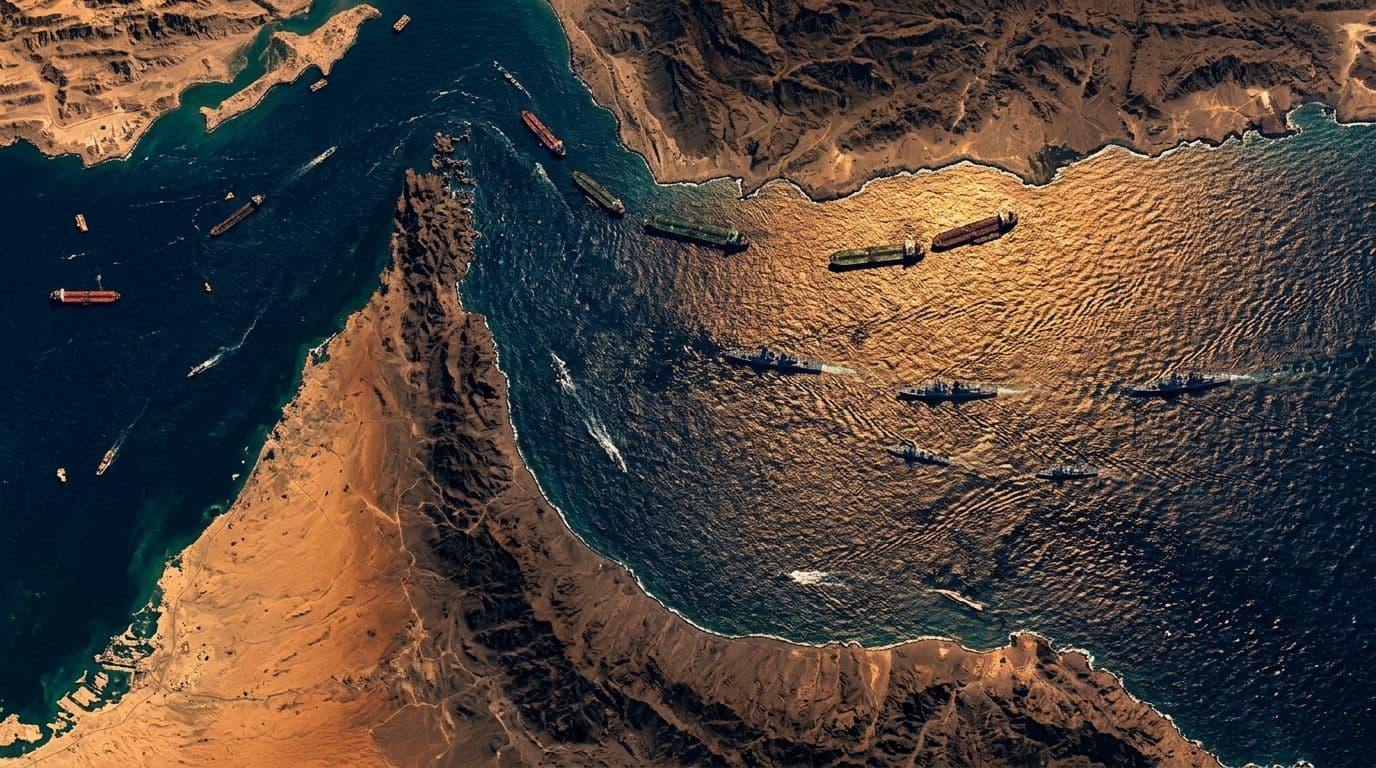 The Strait of Hormuz and nearby tanker traffic under tension, created with AI.
With Iran war tension centered around the Strait of Hormuz, oil traders focus on whether barrels can physically move. Reports in early March 2026 described tanker traffic dropping sharply and some ships being attacked, which is the kind of headline that can push crude into fast, emotional moves. For context on the supply-risk framing markets are reacting to, see Reuters coverage on Hormuz flows and elevated crude.
On a WTI or Brent chart, that usually shows up as:
- Upside gaps when futures reopen, or when liquidity returns after a weekend.
- Long green candles that break above recent resistance on news of strikes, threats, or insurance pullbacks.
- Quick pullbacks if there's talk of safe passage, escorts, or reopened routes.
One simple "if X then Y" example: if oil breaks resistance and the pullback holds above the breakout area, it often signals traders expect disruption risk to last, not just a one-day scare.
Also watch the front of the curve. In plain English, when near-term crude gets pricier faster than later months, the market is paying extra for immediate barrels. That's a classic sign that traders fear near-term supply constraints, not just long-term uncertainty.
Bitcoin chart tells a liquidity story (risk mood, dollar moves, weekend gaps)
Bitcoin can move on the same headline, then reverse for reasons that have nothing to do with oil. That's because bitcoin is heavily influenced by funding, leverage, and broader risk positioning. It also trades 24/7, so it can react before U.S. equity futures fully reset and sometimes before oil has a deep session.
In this March 2026 window, some market reports described crypto weakness alongside spiking crude, which fits the "risk-off first" pattern. For a snapshot of how traders framed that relationship, see CoinDesk's market recap on crypto pressure as oil jumped.
Common tells on the BTC/USD chart during war weeks:
- Large wicks on headline candles, because stops and liquidations hit fast.
- Moves that fade after the U.S. open, when deeper liquidity and hedging flows arrive.
- Choppy action around prior ranges, because traders can't agree if bitcoin is "risk-on" or "hard asset."
A concrete read: if bitcoin spikes on war news but leaves a big upper wick and closes back inside the prior range, the move often reflects short-term panic positioning, not lasting demand.
What traders watch next, the signals that matter more than opinions
 Monitoring oil and bitcoin during thin-liquidity hours, created with AI.
Hot takes feel good, but confirmation pays better. Over the next 24 to 72 hours, traders usually track a short list of signals that either confirm strength or warn of a fade.
When headlines are constant, price action matters most at the close, not at the spike.
For oil, watch the Strait headlines plus the forward curve and energy-linked FX
Start with what changes physical risk:
- Shipping status in the Strait of Hormuz: halted traffic, escorts, or safe passage corridors can flip crude quickly. For background on how attacks and threats are affecting ships, read BBC reporting on ship attacks and oil's reaction.
- Insurance and freight stress: if coverage dries up, the market prices in fewer barrels moving.
- OPEC messaging and supply chatter: traders listen for hints about spare capacity and production flexibility.
- Strategic reserve talk (SPR): even rumors can cap rallies or spark reversals.
Then check confirmation tools:
- Forward curve shape: if front months keep leading, the market still fears near-term shortage.
- Energy-linked FX: CAD and NOK often act as secondary confirmation when oil strength looks real.
For bitcoin, watch the dollar, rates, stablecoin flows, and weekend price behavior
Bitcoin's checklist leans financial, not physical:
- U.S. dollar direction (DXY): a stronger dollar often tightens global liquidity and pressures bitcoin.
- Real yields and rate expectations: higher real yields can weigh on non-yielding assets.
- S&P futures tone: bitcoin often trades as a high-beta risk asset in stressed weeks.
Crypto-specific signals help separate real buying from leverage noise:
- Stablecoin flows and exchange flows: heavy inflows to exchanges can hint at sell pressure, while outflows can hint at holding.
- Funding rates and open interest: if funding overheats and price stalls, a flush becomes more likely.
- Weekend and overnight behavior: big moves often happen when liquidity is thin, then get tested during U.S. hours.
If bitcoin keeps printing higher lows while fear headlines continue, buyers may be real. If it can't hold intraday rebounds, cash is probably in charge.
How to trade the divergence, simple game plans for different risk levels
War headlines can turn any chart into a whip saw. So the goal isn't to predict the next strike, it's to control risk when volatility expands.
A few simple approaches, depending on your style:
Plan A: wait for confirmation, then trade the trend (less stress, fewer trades)
Confirmation is boring, but it filters noise. For oil, that might look like a breakout that holds after a pullback. For bitcoin, it could mean reclaiming a prior range and holding it into the next news cycle.
Use alerts at key levels, then follow a clean rule: if price closes back below the reclaimed level, you're out. That keeps one ugly candle from turning into a week-long problem.
Plan B: trade the chop, but cap downside (range edges, smaller size, faster exits)
In headline markets, both oil and bitcoin can swing from strong to weak in minutes. If you trade ranges, lower your size and shorten your leash.
Keep rules simple:
- Trade near range edges, not in the middle.
- Take profits sooner than usual.
- Use wider stops only if size is smaller.
- Avoid holding big exposure into major scheduled risk events.
Also plan for gaps and slippage. Oil futures can gap on reopening, while bitcoin can gap in practice during thin liquidity even though it trades nonstop.
Conclusion
Oil and bitcoin can react to the same Iran war tension headline, but they usually speak different chart languages. Oil tends to price physical supply risk first, especially when Strait shipping looks uncertain. Bitcoin prices liquidity and risk mood, so it can fall, bounce, or whip around on the same news.
The practical edge comes from having a checklist and sticking to a plan, not chasing every alert. Build a two-chart watchlist (WTI or Brent plus BTC/USD), mark support and resistance, set alerts, then review how each reacts to the next Strait update or ceasefire headline. In markets like this, discipline is the trade.