Cryptocurrency Market 2026 in One Chart Set: 12 Signals on Volume, Liquidity, Fees, and Dominance
Most cryptocurrency posts in 2026 still start with a price call for digital assets. Up, down, sideways, pick a line and defend it. This one’s different.
Instead of opinions, this post uses a small set of charts to explain what actually moved the virtual currency market in 2026, starting with Bitcoin, because bitcoin is the reference point most traders anchor to. The chart set fits into four buckets: volume (participation), liquidity (how easy it is to trade), fees (real usage), and dominance (where capital concentrates).
You’ll get 12 signals, how to read them, and how to avoid common traps like fake volume, thin order books, and one-day fee spikes that don’t mean lasting demand.
How to read the chart set without getting fooled
Charts are like dashboard lights. One light turning on doesn’t tell you what’s broken, it just tells you where to look. Crypto is the same. A volume spike can mean real demand, or it can be wash trading. A fee spike can mean growth, or it can mean bots fighting over block space on blockchain technology.
Start with one rule: never trust one chart. Read signals in pairs. Volume plus liquidity. Fees plus active users. Dominance plus breadth.
Timeframe matters more than people admit. Daily charts catch the “what just happened” story, but weekly charts show the “is this sticking” story. If you only look daily, you’ll get whipsawed by news candles and liquidation cascades. If you only look weekly, you’ll be late to regime shifts.
Smoothing helps, as long as you don’t hide the truth. A 7-day moving average is good for activity and fees. For liquidity, short windows matter because order books can change in hours. Percent changes usually beat raw numbers because crypto grows over time. A 20 percent drop in depth is meaningful, even if the absolute number still looks “big.”
If you want to cross-check data, use multiple sources. Major cryptocurrency exchanges publish volume and spreads. On-chain dashboards publish fees and digital wallet activity. They won’t always match, because each source defines things differently (spot vs derivatives, “active address” rules, what counts as a fee). The goal isn’t perfection, it’s direction.
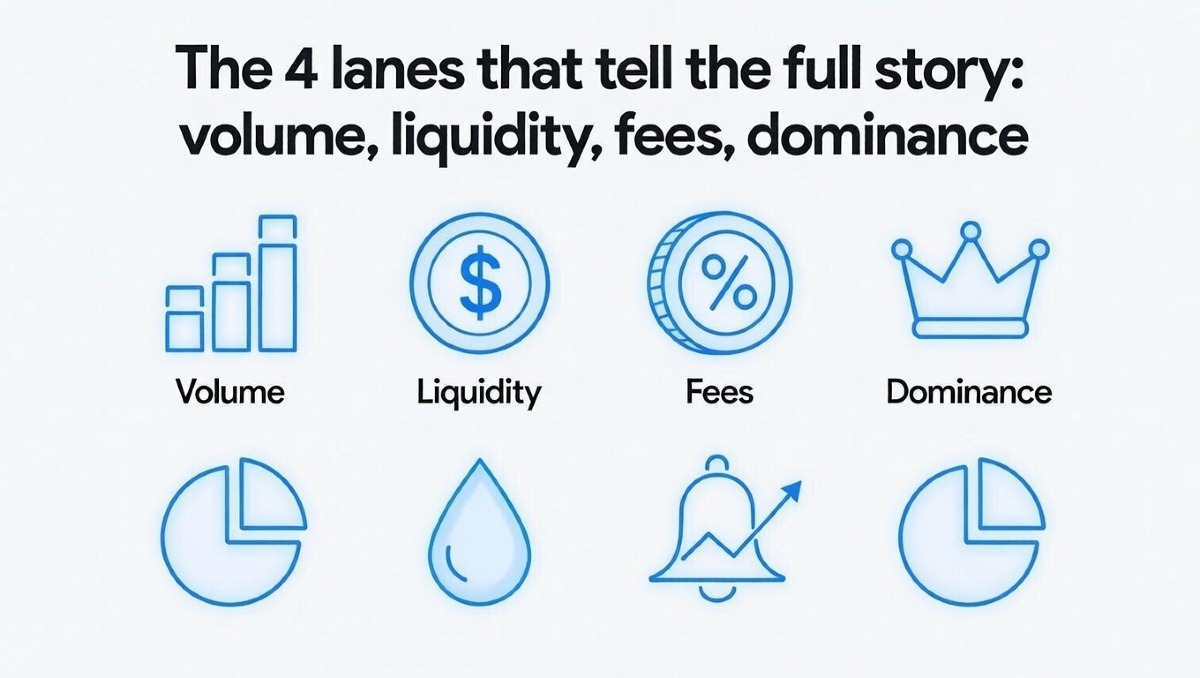
The 4 lanes that tell the full story: volume, liquidity, fees, dominance
Think of these four lanes like a road report.
Cryptocurrency volume answers: are people actually trading, or is price drifting on thin action? Example: Bitcoin can rise on low volume, but it’s easier to reverse.
Liquidity answers: can you trade size without pushing price around? Example: if the order book is deep, a $1 million market order might barely move price. If it’s shallow, it can cause a sudden jump and trigger stops.
Cryptocurrency fees answer: are users using the chain enough to pay for it? Example: if fees rise and stay elevated with steady activity, that can point to real demand. If fees spike for a day and vanish, it might be a short craze.
Dominance answers: where attention and capital are concentrated, typically measured by market capitalization. Example: if Bitcoin dominance rises while alts chop, traders are often playing defense. If dominance falls while liquidity is strong, that’s usually risk-on rotation.
You don’t need every chart under the sun. You need a tight set that keeps you honest when narratives get loud.
3 quick red flags: wash trading, thin order books, and one-off fee spikes
Some signals are “too good.” In 2026, these three traps still caught people.
Wash trading (fake volume), a common crypto scam: volume prints look huge, but the market doesn’t feel active. A simple check is to compare spot volume with perpetual futures volume and open interest. If spot is flat while perps explode, the move can be fragile.
Thin order books: price jumps on small orders because there isn’t much resting liquidity near the current price. A simple check is 1 percent depth (how much you can buy or sell within 1 percent of price). If depth is falling while price rises, expect sharper pullbacks.
One-off fee spikes: fees blow up for a short event, like a mint frenzy or bot war, then normalize fast. A simple check is to compare fees with active addresses. If fees spike but active users don’t rise much, it may be congestion without growth.
With those traps in mind, the 12 signals below get easier to trust.
The 12 signals that mattered most in 2026
Each signal is a “mini card” you can track weekly. None is magic. Together, they show whether moves are built on real participation, tradable liquidity, and sustained usage, or on fumes.
Volume signals: what real participation looked like
-
Signal 1: Spot trading volume trend vs perp trading volume trend
What it is: compare spot trading with perpetual futures activity, particularly for bitcoin. Why it matters: spot demand tends to be stickier. Bullish read: spot and perps rise together. Bearish read: perps surge while spot stays muted. Common mistake: treating perp-only volume as “real adoption.” -
Signal 2: Trading volume on up days vs down days
What it is: does more volume show up on green days or red days? Why it matters: it hints at accumulation versus distribution. Bullish read: higher volume on up days, calmer selling. Bearish read: heavy volume on down days, weak bounces. Common mistake: ignoring the bigger trend and over-reading one week. -
Signal 3: Breadth of trading volume across top assets
What it is: how many large coins share the action. Why it matters: narrow rallies reverse faster. Bullish read: volume spreads across majors, not just one or two flyers. Bearish read: a small cluster carries the whole tape. Common mistake: confusing “a few coins pumping” with broad market strength.
One extra nuance in 2026: spot volume often ran through stablecoin pairs. When stablecoin pairs dominate and spot breadth improves, it can signal fresh risk appetite. When stablecoin pairs dominate but breadth shrinks, it can signal traders staying cautious and rotating quickly.
Liquidity signals: how easy it was to trade size without slippage
Slippage is the hidden fee you feel when the market moves against you while your order fills. If you try to buy Bitcoin and your average fill ends up higher than expected, that gap is slippage. In strong liquidity, it’s small. In weak liquidity, it bites.
-
Signal 4: Order book depth near price (1 percent depth)
What it is: total bids and asks within 1 percent of price for bitcoin and majors. Why it matters: depth supports breakouts and cushions dips. Bullish read: depth rises with price. Bearish read: depth drains during rallies. Common mistake: looking at a single exchange instead of a blended view. -
Signal 5: Bid-ask spreads on top pairs
What it is: the gap between best bid and best ask. Why it matters: tight spreads mean active market makers and lower friction. Bullish read: spreads stay tight during volatility. Bearish read: spreads widen before or during drops. Common mistake: assuming spreads only matter for day traders, they also signal market stress. -
Signal 6: Stablecoins supply and exchange balances as liquidity fuel
What it is: how much “dry powder” sits in stablecoins, and how much is positioned on exchanges. Why it matters: available capital can support dips and fund breakouts. Bullish read: stablecoin balances rise before risk-on moves, then rotate into spot. Bearish read: balances rise after rallies as traders cash out. Common mistake: treating any stablecoin growth as bullish without timing context.
Liquidity can vanish fast during news shocks. That’s why this lane often leads price, not the other way around.
Fees and activity signals: when usage was real, and when it was hype
Fees are easy to misread because extreme spikes are dramatic. In 2026, the better tell was the boring middle.
-
Signal 7: Median fees, not max fees
What it is: track the median fee users actually paid on networks like ethereum, not the peak. Why it matters: max fees get distorted by bots and bidding wars. Bullish read: median fees rise gradually with activity. Bearish read: median fees stay flat while only max fees spike. Common mistake: calling “adoption” from a single day of chaos. -
Signal 8: Fee revenue vs token incentives
What it is: are users paying fees because they want the block space, or because incentives including mining rewards are paying them to show up? Why it matters: organic demand lasts longer than farmed demand or mining-subsidized usage. Bullish read: fee revenue holds up when incentives fade. Bearish read: activity drops as soon as rewards shrink. Common mistake: confusing subsidized usage with product-market fit. -
Signal 9: Active addresses and transaction counts paired with fees
What it is: activity metrics viewed alongside fees. Why it matters: each combo tells a different story. Bullish read: active users rise and fees rise, demand is real. Neutral-good read: transactions rise while fees fall, scaling improved. Bearish read: transactions rise but users don’t, spam is likely. Common mistake: celebrating raw transaction counts without user context.
Fees tie back to user experience. If costs stay high, activity often shifts to other chains or to layer-2 networks. That migration shows up later in dominance and liquidity.
Dominance signals: where capital concentrated, and when it rotated
Dominance is the “attention map.” It doesn’t tell you what’s best, it tells you what’s crowded, and what’s being ignored.
-
Signal 10: Bitcoin dominance trend
What it is: bitcoin market cap share versus the rest. Why it matters: it often reflects risk mood. Bullish for caution: dominance rising while price holds, traders prefer the anchor. Bullish for alts: dominance rolling over with strong breadth. Common mistake: assuming falling dominance always means “altcoins season,” without checking liquidity. -
Signal 11: Ethereum and sector dominance to spot rotation
What it is: ethereum market cap share and sector share (like DeFi, L2s, memecoins, AI tokens). Why it matters: rotations often start quietly, then go loud, shifting from majors to altcoins. Bullish read: sector dominance rises with improving volume breadth and tight spreads. Bearish read: dominance jumps on hype while liquidity stays shallow. Common mistake: chasing the last sector that already had its run. -
Signal 12: Stablecoin dominance and market cap share (the parking lot effect)
What it is: stablecoins as a share of total crypto value, relative to circulating supply. Why it matters: stablecoins are the parking lot when traders step out of risk. Bullish read: stablecoin share falls as spot demand grows. Bearish read: stablecoin share rises while spreads widen and depth drops. Common mistake: ignoring stablecoin share because “it’s not a coin that pumps.”
A simple rotation playbook many used in 2026: wait for dominance to break trend, confirm with volume breadth and liquidity, then cut risk fast if breadth fades or spreads widen.
Putting the signals together: 3 setups traders watched in 2026
Signals are only useful when they change what you do next in the cryptocurrency market. The goal isn’t to predict every wiggle, it’s to avoid being confident at the wrong time.
Before the setups, one risk note: when liquidity is thin in cryptocurrency markets, position sizing matters more than entries. Smaller size, wider stops, and less borrowed exposure can keep a small mistake from turning into a forced exit. If spreads are widening and depth is falling, treat every breakout as guilty until proven innocent.
Setup 1, a Bitcoin-led breakout that held
The mix looked clean: spot volume rose alongside perp volume, but spot wasn’t lagging. Order book depth improved near price, and spreads stayed tight even as bitcoin pushed higher. Fees and activity stayed steady, which suggested no short-lived spam wave.
Dominance helped confirm the mood. Bitcoin dominance stayed flat or in a gentle uptrend, which often meant the market was adding risk, but not in a reckless way.
What confirmed it was follow-through with stable liquidity. What would’ve broken the setup was a perp-only surge, thinning depth, and sudden spread expansion while price kept climbing.
Setup 2, an alt season burst that faded fast
This one started with falling Bitcoin dominance and loud narratives in a narrow set of tokens. Volume looked huge, but breadth was deceptive across market cap. A handful of names carried the move, while many large market cap alts stayed quiet.
Liquidity told the truth. Depth was shallow in many alts, spreads widened as volatility rose, and the market became jumpy. Fees on some chains spiked hard, but it didn’t always come with a matching rise in real users.
After the run, stablecoins dominance often ticked up. That “parking lot” move was the giveaway that traders were cashing out, not re-loading.
Setup 3, a risk-off shift when liquidity dried up
This setup didn’t need a headline, even one from the securities and exchange commission. It showed up in micro-signals amid central bank policy pressures: spreads widened, depth fell, and price started to gap more between trades. Perp liquidations picked up, and spot volume weakened.
At the same time, stablecoins share grew and bitcoin dominance rose. Traders weren’t leaving crypto for fiat currency in a single stampede, they were sliding into the safest lane inside crypto first, often securing funds in digital wallets during high volatility.
The takeaway was practical: reduce borrowed risk, don’t chase bounce candles, and wait for depth and spreads to normalize before trusting any “V-shaped” recovery.
Conclusion
The big lesson from 2026 wasn’t a secret indicator; it was reading the cryptocurrency market like a blockchain technology system:
-
Volume tells you if participation is real in this decentralized ecosystem.
-
Liquidity tells you if the move is tradable, or just fragile.
-
Fees tell you when usage is sustained from smart contracts and decentralized networks, not just noisy, with proof of work or proof of stake consensus mechanisms influencing those signals.
-
Dominance tells you where money is hiding, and where it’s taking risk.
Bitcoin stayed the anchor chart for most regimes, even when alts stole the spotlight. Unlike the speculative initial coin offering eras of the past or traditional legal tender systems, build a weekly checklist with the 12 signals from the transparent public ledger, grounded in cryptography. Track them for a month, secure your private keys in a cold wallet over a hot wallet for risk management, and watch how often the same patterns show up when Bitcoin leads risk-on or flips the virtual currency market back to defense.