Crypto Price Prediction for March 2026: Bitcoin, Ethereum, and XRP Try to Rebound
February punished crypto holders. Prices slid hard, liquidations rose, and confidence thinned out. In early March 2026, the tone has shifted from panic to a rebound attempt, even as many traders still feel cautious.

Crypto Price Prediction for March 2026: Bitcoin, Ethereum, and XRP Try to Rebound
February punished crypto holders. Prices slid hard, liquidations rose, and confidence thinned out. In early March 2026, the tone has shifted from panic to a rebound attempt, even as many traders still feel cautious.
Bitcoin and Ethereum, prominent digital assets, have posted the following price levels: Bitcoin is hovering near $69,000 to $70,000, after recently testing much lower levels. Ethereum is near $2,050 (with wide prints across exchanges in the high-$1,800s to low-$2,000s). XRP is holding around $1.38 to $1.42 after bouncing off early March lows. The cryptocurrency market capitalization sits around $2.46 trillion, and sentiment has been described as extreme fear, with some measures printing near 8 out of 100.
A rebound attempt matters because it reveals who is buying and why. Short-term traders look for quick momentum and clear invalidation points. Long-term holders watch for signs that forced selling is done. Still, long-term crypto price predictions are not guarantees. Risk management matters more than any forecast.
What is driving this rebound attempt across the crypto market right now?
Crypto often moves as a pack during stressful weeks. Even when Bitcoin leads, Ethereum and XRP can follow because the same headlines drive risk appetite. In March 2026, three forces stand out: macro policy timing, shifting market sentiment, and large flows that can change the tape quickly.
 ### Macro pressure: Fed policy, tariffs, and risk appetite
The Federal Reserve meeting on March 17 to 18 is a near-term calendar anchor. Traders tend to reduce exposure ahead of major rate decisions, then re-price risk right after the statement and press conference, as historical data shows. Current expectations lean toward no change in rates, but the message matters as much as the decision, guiding investment decisions. If the Fed signals patience and softer inflation risk, markets often relax. If it hints that inflation could re-heat, risk assets can wobble.
Rates connect to crypto through liquidity and opportunity cost. When cash yields are high, investors get paid to sit in money markets. That can pull funds away from volatile assets. On the other hand, when investors expect easier policy later, they tend to front-run that shift by buying risk sooner.
Tariff and geopolitical headlines also matter because they can trigger "risk-off" moves. In risk-off, investors often sell what they can, not only what they want to. Crypto can fall even without crypto-specific bad news, simply because traders reduce exposure across the board.
Sentiment and flows: extreme fear, ETF demand, and liquidity events
Extreme fear can mark a durable low, but it can also precede another flush. The key is whether sellers run out of urgency. The fear and greed index near 8 out of 100 tells you positioning is defensive. It does not promise that price must bounce.
Flows, however, can turn a fragile market into a fast rally. U.S. spot Bitcoin ETFs recently showed renewed inflows after months of withdrawals, even though a late-week outflow day reminded traders that demand is not one-way. When ETFs absorb supply on down days, it supports the idea that large buyers are stepping in.
Tax season can also change near-term liquidity. Refund timing and rebalancing flows can add incremental demand in March, especially when sentiment is already stretched. That extra buying power rarely creates a bull market by itself, but it can help a bounce survive its first pullback.
For a quick reference on where Bitcoin is trading as the week unfolds, see this BTC price snapshot.
A rebound attempt becomes a trend only when dips get bought quickly and new lows stop printing.
Bitcoin price prediction: the key levels that decide whether BTC's bounce holds
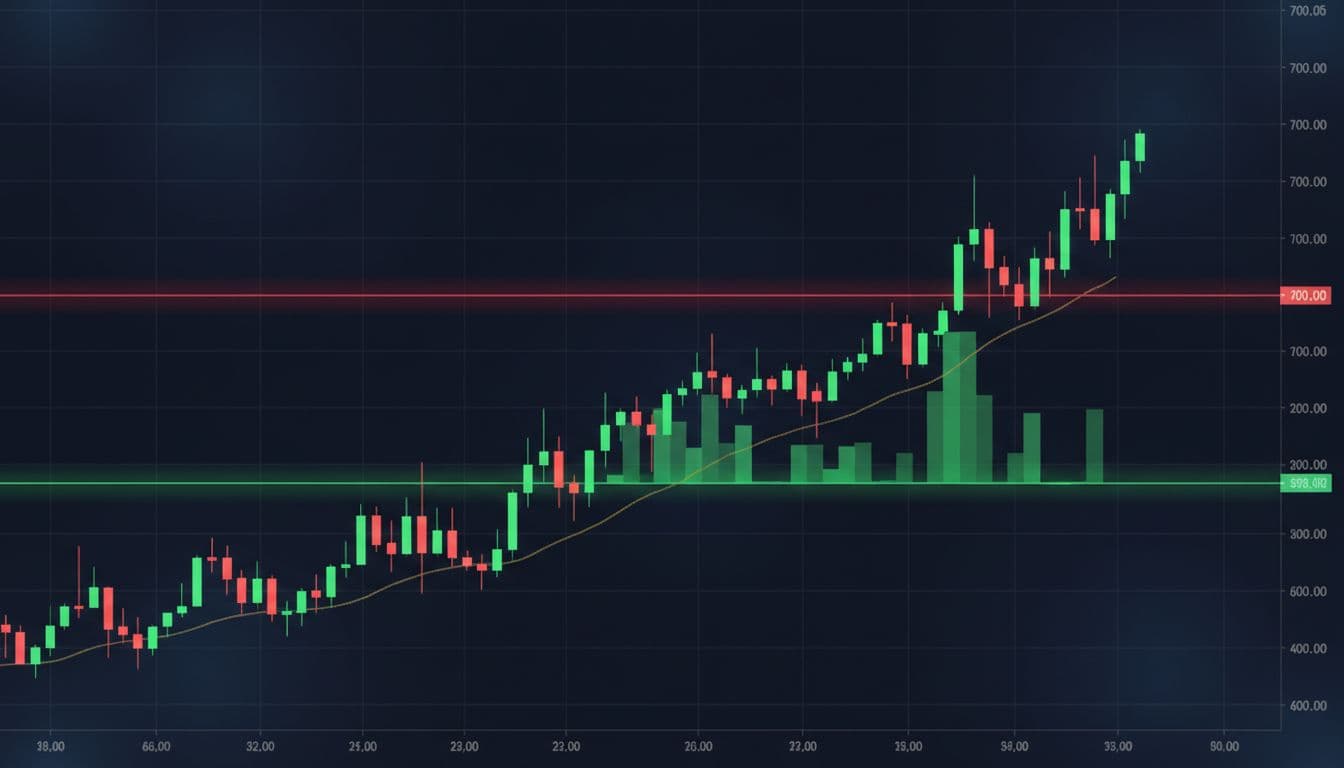
Bitcoin still acts like the market's spine. If BTC stabilizes, altcoins breathe. If BTC breaks support, most charts look sick at the same time. That is why a practical Bitcoin price prediction for late March should focus less on bold targets and more on levels in price charts that separate a "higher low" from a failed rally.
A higher low is simple: price pulls back, but it stops above the prior swing low. A failed rally is also simple: price breaks up briefly, then falls back below the breakout level and accelerates lower. In extreme fear conditions, failed rallies happen often, especially near round-number resistance.
 ### BTC's price map: support near $62K to $65K, resistance near $70K to $75K
Technical indicators such as moving averages, RSI, and MACD help identify key levels like the recent demand zone in the low-$60Ks. Support around $62,000 to $65,000 matters because it is where buyers previously defended price and where many stop-loss clusters sit. If BTC revisits that area and bounces, it keeps the rebound narrative alive. If it slices through, sellers often press until a new pocket of demand appears.
Resistance is close overhead. The $70,000 area is psychological, while $72,000 to $75,000 is the band where rallies can stall. Bulls want to see daily closes above resistance, then fewer sharp pullbacks. In plain terms, they need price to hold gains overnight, not only in intraday spikes.
Also watch behavior, not just numbers, to gauge price movement direction. Strong bounces often show steadier candles and rising volume on up days. Weak bounces often show thin follow-through and fast give-backs when U.S. equities turn red.
Base case, bullish case, bearish case for late March
This table frames late March as three scenarios rather than a single "prediction."
| Scenario (late March 2026) | What it would look like | Practical BTC range |
|---|---|---|
| Base case | Choppy consolidation, dips bought, rallies capped | High-$60Ks to low-$70Ks |
| Bullish case | Clear break and hold above $73K to $75K, flows improve | Mid-$70Ks (roughly $74K to $78K) |
| Bearish case | Risk-off returns, support fails, momentum turns down | Retest low-$60Ks (roughly $62K to $65K) |
The base case fits the current tape because fear is high and macro risk is close. A sideways market can still be profitable for short-term trades, but it punishes impatience.
The bullish case needs two ingredients: better risk sentiment after the Fed meeting, plus steady ETF demand. Some short-term forecasts also point toward mid-$70Ks when momentum turns, but treat them as tools, not facts. One example is this CoinCodex BTC forecast, which illustrates how model-based targets can cluster near key resistance.
The bearish case remains credible because fear is extreme and headlines can flip quickly. If BTC loses the $62K to $65K shelf, it signals that buyers stepped back, or that forced selling returned.
For another perspective on timing and thresholds, this Bitcoin weekly prediction analysis is useful as a cross-check, even if your strategy differs.
Ethereum price prediction: what needs to improve for ETH to lead again
Ethereum tends to lag when Bitcoin dominance rises. Market trend analysis highlights how, during stress, traders often crowd into BTC because it feels like the "cleanest" crypto bet. That dynamic can leave ETH grinding sideways even when Bitcoin bounces.
Still, ETH can regain leadership when two things happen: Bitcoin volatility cools down, and buyers show up in size for large-cap alts. In early March, ETH has shown signs of stabilization with higher volume on rebounds, while institutions appear more active through ETFs and direct accumulation.
 ### Current Ethereum price range and the breakout signal to watch
ETH's working range is roughly $1,930 to $2,160, with price recently near $2,050. Ranges are not boring when you trade them correctly. They provide clear boundaries for invalidation.
A clean breakout usually has three traits that confirm the price movement direction. First, ETH pushes through the top of the range and closes near the high. Next, it holds that level on a pullback. Finally, volume remains firm without immediate "snap-back" selling. In contrast, a quick spike above $2,160 that reverses the same day often traps late buyers.
Range leadership also matters. If ETH reclaims the top of its band while BTC only chops, it signals rotation into risk. That often helps other large alts as well.
Catalysts for ETH: big buyers, network roadmap, and a friendlier macro backdrop
Institutional behavior matters for ETH because supply can tighten when long-term holders accumulate. Reports of large buyers adding meaningful ETH positions, plus ETF inflows on stronger days, support the idea that some funds are building exposure rather than trading noise.
Network improvements also shape long-term demand. Lower fees and better throughput tend to make Ethereum more usable, which supports activity across DeFi and tokenized assets. That link is not instant, but it compounds over time. If users and developers stay engaged, the chain's economic activity tends to support the digital currency's value proposition.
Macro remains the near-term swing factor. If the Fed meeting calms markets and equities stabilize, ETH often benefits because investors feel safer stepping out on the risk curve.
For a quick view of one near-term target framework, see this ETH target range analysis, which highlights how closely the market is watching the $2,100 to $2,200 area.
Ripple (XRP) price prediction: a rebound is possible, but the chart has a clear gatekeeper level
XRP often trades like a headline-sensitive asset. When regulation news turns positive, it can move sharply. When news stalls, the chart tends to compress into tight ranges, then break suddenly in either direction. Ai-powered predictions and prediction models underpin the price targets discussed here, providing data-driven insights into potential moves.
Right now, the setup is straightforward. XRP is trying to hold its bounce while repeatedly testing nearby resistance. In a fear-heavy market, repeated tests can be a good sign because sellers get absorbed. At the same time, failed breakouts happen often when liquidity is thin, resembling a random walk process.
 ### XRP's key levels: resistance near $1.42 to $1.46, support near $1.27 to $1.28
The gatekeeper is $1.42 to $1.46. That band has acted like a ceiling, and ceilings matter because they reflect where sellers feel safe. Each time price taps resistance and pulls back, the market collects information in what amounts to a regression problem. Either supply runs out and price pushes through, or buyers lose patience and the range breaks down.
Confirmation is not mystical. Bulls want to see XRP hold above $1.46 on strong volume, then treat that zone as support. If price breaks above and immediately falls back below, it often signals a bull trap.
Support sits near $1.27 to $1.28. If XRP loses that floor, the chart signals that the rebound failed. In that case, the next bounce can be weaker because buyers remember the last breakdown and reduce size.
Scenario outlook for March: steady range, breakout to $1.60 to $1.75, or a slip back to support
A steady range remains the most common outcome when macro risk stays high. Under that scenario, XRP oscillates between roughly $1.30 and $1.46, with traders selling strength and buying dips. It is not exciting, but it is realistic.
A breakout scenario opens if two conditions align: BTC holds its support zone and altcoin rotation returns. Then XRP can push into the $1.60 to $1.75 area by late March, particularly if regulation headlines turn favorable or ETF chatter intensifies. That estimate draws from LSTM, neural networks, deep learning applied to time series data. Treat it as an informed projection, not a promise. Price needs real follow-through, not only social buzz.
The bearish scenario appears if risk-off returns after the Fed meeting, or if Bitcoin breaks down. In that case, XRP can slip back toward $1.27 to $1.28 quickly, because thin order books amplified by algorithmic trading can accelerate declines.
For a model-based range discussion that matches these levels, this crypto price prediction XRP March 2026 outlook provides a helpful benchmark.
Conclusion
Our prediction algorithm shows this rebound attempt can turn into a real recovery, but it can also fade fast in extreme fear conditions. Keep the focus on what price is proving, not what you hope it will do.
Use this short checklist, aligned with key price estimates, before making decisions:
- Watch the Fed meeting outcome and the market's reaction.
- Track whether BTC holds the $62K to $65K support zone.
- Look for ETH reclaiming the top of its $1,930 to $2,160 range.
- Wait for XRP to break and hold above $1.46.
Above all, protect your downside with position sizing, avoid chasing sudden spikes, and set a clear invalidation level before entering a trade, ensuring informed investment decisions.