BTC Moves After Iran Drone Headlines: What to Expect Next
When Iran drone and missile headlines hit in early March 2026, markets flipped from calm to tense in minutes. Oil jumped, stock futures wobbled, and traders rushed to cut risk. Bitcoin (BTC) did what it often does during surprise geopolitical shocks: it dipped fast, then bounced as panic cooled.
If you felt whiplash, you're not alone. BTC trades 24/7, so it reacts before many traditional markets even open. That makes crypto feel like the "first draft" of risk sentiment.
This post breaks down what likely drove the move, which signals matter most over the next few days, and how to plan without letting headlines push you into bad trades.
What the Iran drone headlines changed for markets, and why BTC reacted

An AI-created illustration of a fast BTC dip and bounce after a sudden global risk headline.
Geopolitical shocks tend to trigger the same chain reaction. First comes the surprise headline, then the "risk-off" switch. Traders sell what's easy to sell, they buy what feels safer, and they raise cash. In early March 2026, reports described waves of Iranian drones and missiles across the region, which raised fears of a wider conflict and possible energy supply disruption.
BTC sits in a tricky spot during these moments. Some investors treat it like "digital gold" over long time periods. Still, in the first hours of a shock, BTC often trades like a risk asset, closer to high-beta tech than to gold. That's because crypto markets are heavy on short-term positioning, and because leverage can amplify any move.
The first 24 hours, it is mostly positioning, not fundamentals
Most "headline candles" are about plumbing, not philosophy.
A quick drop often starts with leveraged traders getting forced out. When price slides, stop losses trigger. Then liquidations hit, which is like an automatic sell button firing because collateral no longer covers the loan. If order books are thin (meaning not many buy orders are sitting nearby), price can fall faster than you'd expect.
Then, just as quickly, the market can bounce once forced selling slows. That's what several market recaps pointed to, including a report of roughly $300 million in crypto liquidations alongside BTC rebounding to the mid-$66k area after the initial dip (risk-off session recap). A bounce like that doesn't mean the fear is gone. It does suggest the first wave was more about positioning than long-term holders suddenly "giving up."
Oil, the dollar, and stocks, three outside forces that often pull BTC around
Oil matters because it feeds inflation worries. If oil spikes, traders start thinking about stickier inflation. That can shift interest rate expectations, which often lifts the US dollar and pressures stocks.
Here's the simple connection: when stocks fall hard, BTC often dips too in the short run. Correlations change over time, but during stress, markets tend to move together because the same funds and the same emotions are involved.
At the same time, BTC doesn't always mirror equities tick for tick. In some shocks, it holds up better than tech because crypto can recover faster once panic selling clears. That's a pattern, not a promise.
Key BTC price zones and signals to watch next (without staring at charts all day)
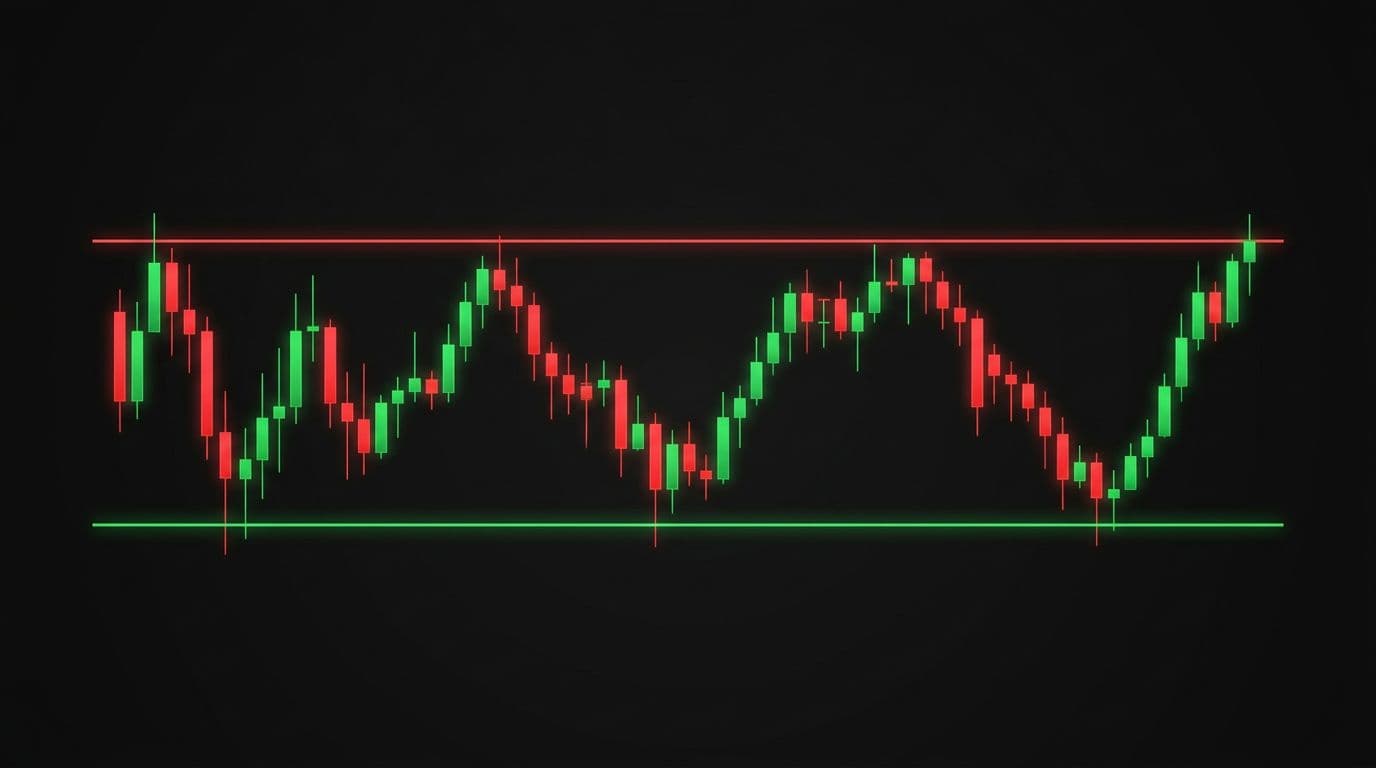
An AI-created visual of BTC chopping between support and resistance zones.
If you only do one thing this week, make your plan around zones, not single numbers. In March 2026, traders have been watching BTC move in a broad range, roughly $60k to $72k, with a lot of action clustered in the $60k to $60k-highs and the upper $60ks. Think of these as weather forecasts, not guarantees.
You don't need ten indicators. A practical framework is:
- Support: where buyers previously showed up.
- Resistance: where sellers previously showed up.
- Volatility: how wide the daily swings are.
- Confirmation: whether price can hold a move, not just spike.
The market's first move is often the loudest, but not the most important. What matters is where BTC settles after the noise.
The "line in the sand" idea, what a break below support could mean
Support is a floor made of memory. It's where buyers previously said, "This is cheap enough."
If BTC breaks below the low to mid-$60k area and stays there, it can invite another wave of selling toward $60k and possibly below, especially if the S&P 500 and Nasdaq slide at the same time. That's not a prediction. It's how crowd behavior often works when fear spreads and traders rush to reduce exposure.
Don't treat one quick dip as "the break." Look for sustained closes (like several hours, or a daily close) and stronger volume. One fast wick can be nothing more than stops getting swept.
For a separate take on the weekend dip and quick recovery, including mention of BTC trading around the mid-$66k area after falling toward $63k, see this market note from FXStreet's coverage of BTC holding stronger than expected.
What a push above resistance would tell you about sentiment
Resistance is the ceiling, the spot where sellers previously said, "Good enough, take profit."
If BTC can reclaim the upper $60k area and hold it, that often signals sentiment is shifting from fear back toward "buy the dip." One common pattern is ugly volatility, then tight consolidation, then a breakout attempt. The key word is hold. A quick pop that fades in minutes is usually just short covering.
Practically, it helps to wait for confirmation instead of chasing a green candle. If the breakout is real, it tends to offer more than one entry.
Three realistic paths from here, and how to plan for each one

An AI-created scene of a trader watching markets during fast-breaking geopolitical news.
Headlines can make the future feel binary, up or down. In reality, most outcomes fall into a few repeatable paths. Scenario thinking helps because it removes the need to "be right" today.
Scenario 1, tensions cool and BTC stays choppy but stable
In this base case, the news flow slows down and markets stop gap-opening. Volatility fades, but BTC still chops inside its recent range. Traders shift back to macro data, ETF flow chatter, and technical levels.
Planning ideas that keep you steady: set price alerts near your zones, scale entries instead of going all-in, and avoid high margin. Also keep some dry powder. Choppy ranges reward patience more than bravery.
Scenario 2, escalation brings a risk-off wave first, then a possible rebound later
If the conflict escalates, the first move is often "sell risk." That can pull stocks down, lift the dollar, and pressure BTC again. Later, a different story can take over, such as inflation worries from energy, higher government spending, or looser financial conditions over time. Those themes can support scarce assets, but the timing is messy.
Derivatives can add fuel here too. One report noted extreme bearish positioning signals after the strikes, alongside oil's sharp move at the open (Asia market risk-off summary). When traders are crowded to one side, sharp bounces become more likely.
Risk steps that actually help: define your max loss before entering, cut position size during high-volatility weekends, and don't "revenge trade" after a stop-out.
Conclusion
Iran drone headlines were a classic stress test for BTC. Fast drops can come from forced selling, not a sudden change in long-term belief. The next leg likely depends on whether markets stay risk-off, especially stocks, the dollar, and oil, and whether BTC holds key zones around the low to mid-$60ks or reclaims the upper $60ks.
Over the next few days, keep it simple: watch oil and equity futures, track BTC support and resistance, and keep position size sane. Most importantly, write your plan when you're calm, not when your phone pings. Discipline beats prediction when the headlines won't stop.