Bitcoin to $1 Million: The 17% Store-of-Value Shift Explained
Blockchain technology and digital asset for portfolios, reaching $1 million depends less on hype and more on market size.

Bitcoin to $1 Million: The 17% Store-of-Value Shift Explained
Bitcoin, the leading cryptocurrency powered by blockchain technology and digital asset for portfolios, reaching $1 million depends less on hype and more on market size. A "store of value" is simply a place people park money to protect purchasing power over time. Gold is the classic example. It wants a seat at that table.
The core idea behind many $1 million narratives is straightforward: if a meaningful share of capital preservation demand moves from older assets into Bitcoin, the math can support much higher prices. The hard part is timing, because large pools of money rarely move quickly.
In March 2026, Bitcoin trades around the high five figures, and many 2026 forecasts still cluster far below $1 million. A seven-figure price is usually framed as a 2030 to 2040 target, not a near-term base case. This post explains the "17% shift" claim step by step, so you can judge it on numbers, not headlines.
What "store of value" means, and what Bitcoin is competing against
Wealth preservation demand is about preservation, not paying for groceries. People choose these assets when they worry about inflation, currency controls, bank risk, or a long period of weak returns elsewhere. In other words, they want something that can hold value when confidence feels thin.
Bitcoin's competition is broader than it looks at first glance. Gold is the headline rival for Bitcoin, but it's not the only place people "park" wealth. Bitcoin competes against cash and cash equivalents when safety matters more than return (even if inflation erodes buying power). Bitcoin also faces government bonds when investors trust the issuer and want stable income. Real estate challenges Bitcoin when people want a hard asset and can handle low liquidity. Large-cap equities rival Bitcoin when investors treat them like long-term wealth containers, not short-term bets.
As of March 2026, Bitcoin's market capitalization sits around $1.4 trillion, with BTC USD price near $70,000. Even small changes in who holds wealth preservation assets, and in what proportions, can move BTC sharply because Bitcoin is still small relative to the biggest pools. For a quick snapshot of day-to-day pricing, see this BTC market data page.
Bitcoin's wealth preservation pitch in one page: scarcity, portability, and ownership
Bitcoin's pitch as a wealth preservation asset rests on a few concrete properties.
First, supply is capped at 21 million coins, a feature envisioned by Satoshi Nakamoto in his 2008 white paper describing Bitcoin as an electronic cash system. That hard limit is the anchor for the "digital scarcity" story. Second, Bitcoin can move across borders quickly via its decentralized peer-to-peer network, without needing a bank to approve the transfer. Third, holders can self-custody this digital asset, which means they can own it directly through a private key.
Those features matter most in places where banking access is limited, capital controls appear overnight, or trust in institutions runs low. They also matter to investors who want an asset that isn't tied to any single government.
Still, wealth preservation status comes with trade-offs. Volatility remains high. Custody mistakes can be permanent. Regulation can shift, especially around taxes, reporting, and custody standards. Bitcoin also relies on secure key management and internet access. None of those risks are theoretical, so any wealth preservation claim has to account for them.
Gold is the benchmark, and it sets the scale for the $1 million narrative
Gold sets the reference point because it has a long history as monetary metal, and it trades in deep global markets. It also helps set the "scale" conversation. In early 2026, several estimates place gold's market capitalization around the mid tens of trillions, with a reasonable range depending on the price and reserve estimates.
 That comparison matters because Bitcoin is still much smaller. If Bitcoin captures even a slice of gold-like demand, the implied market cap change can be enormous relative to today's size. A helpful context piece on safe-haven differences is Gold vs Bitcoin in 2026, which frames why some investors treat them as complements, not strict substitutes.
The 17% shift explained with simple math, and what it implies for price
The "17% store of value shift" is not a law of nature. It's an assumption about adoption share. The claim usually runs like this: take a large store-of-value pool (often gold, sometimes a broader pool), then assume Bitcoin captures 17% of it over time. Convert that capture into a Bitcoin market cap, then divide by the number of coins.
The math is simple, even if the path is not.
If you understand the base pool and the assumed share, you can test almost any $1 million headline in minutes.
Step-by-step: from asset reallocation to Bitcoin market cap, then to price per coin
 Here's a clean sequence you can follow:
- Pick a store-of-value pool. Some models use gold alone. Others use a broader "wealth storage" pool that includes gold plus other long-term value stores.
- Assume Bitcoin captures 17% of that pool over years (not weeks).
- Compute implied Bitcoin market capitalization: Pool × 17%.
- Estimate price per coin: Market capitalization ÷ 21 million (the max supply cap envisioned by Satoshi Nakamoto). In practice, circulating supply is lower, but keeping 21 million makes the math transparent.
A small table makes the effect of assumptions easy to see. These are illustrative round numbers, not forecasts.
| Assumed store-of-value pool | 17% share implies BTC market cap | Implied price per BTC (cap supply) |
|---|---|---|
| $36T (gold-only style base) | $6.12T | ~$291,000 |
| $70T (broader SoV base) | $11.9T | ~$567,000 |
| $90T (broader SoV base) | $15.3T | ~$729,000 |
Two takeaways follow.
First, gold-only math often lands below $500,000 unless you assume an unusually large gold base, an unusually high share, or both. Second, the $500,000 to $750,000 band shows up when the assumed store-of-value pool is broader than gold. In that framing, "$1 million" usually requires a bigger pool, a bigger share, a lower effective supply, or some combination.
Why "17%" is not a magic number, and what has to be true for it to happen
Seventeen percent sounds precise, which is why it gets repeated. Still, it's just a market-share guess. For it to become plausible, several real-world conditions need to hold for a long time.
Custody must feel routine, not risky. That includes better key management, stronger insurance, and clear processes for institutions. Liquidity also needs to deepen, so large buyers can enter without moving price too much. Volatility often has to cool as well, because many mandates limit exposure to assets with extreme drawdowns. Bitcoin's proof of work consensus, powered by mining for supply issuance and secured by SHA-256 hashing on its decentralized distributed ledger, must continue providing robust security and trust without central authorities.
Regulation matters too. Clearer rules for reporting, custody, and market oversight reduce friction for large allocators. Even then, adoption has to show staying power outside speculative cycles, which is a different test than a single bull run.
On the other hand, several factors could block a 17% outcome: sustained harsh restrictions in major markets, a protocol-level failure, repeated custody blowups that undermine trust, or a long stretch where Bitcoin underperforms safer assets on a risk-adjusted basis. A store of value is supposed to help people sleep, not create new operational risk.
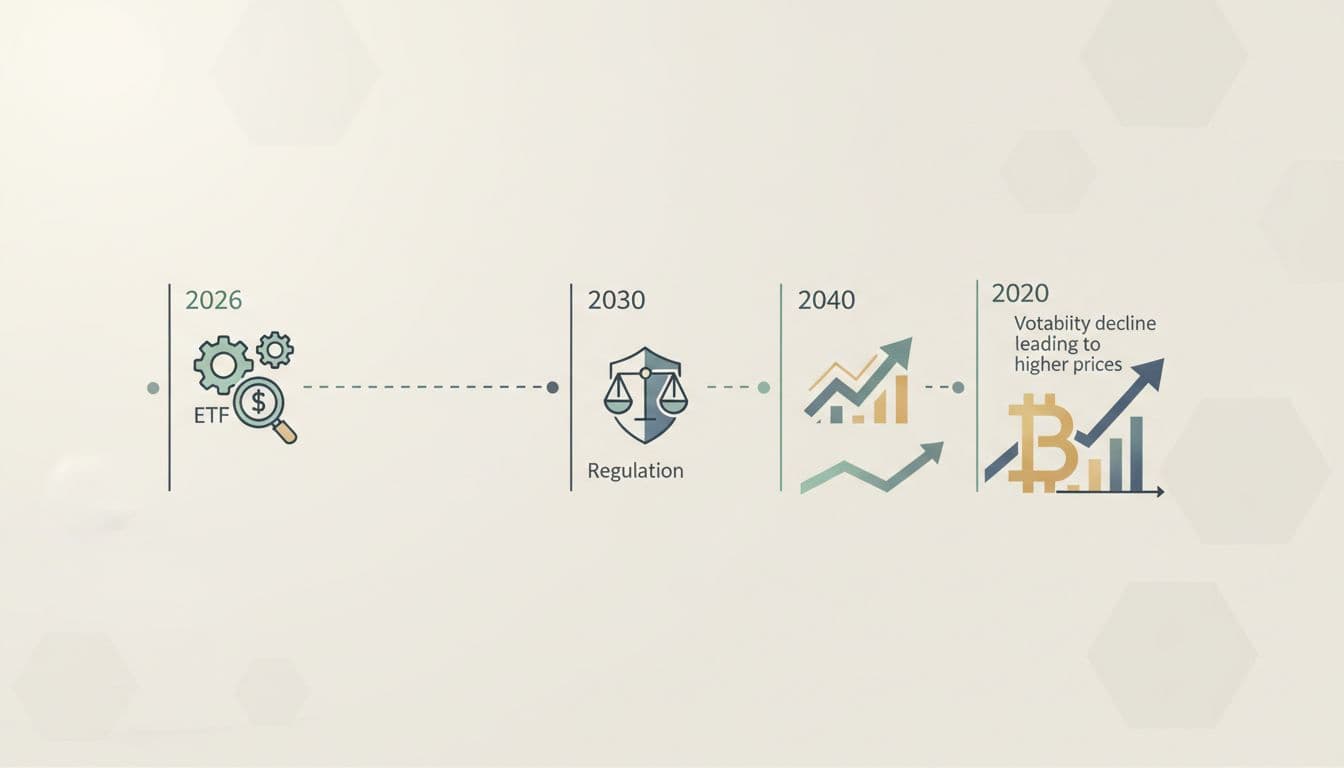
Timing the path to $1 million: why most 2026 forecasts stay far below it
Even if you accept the long-run math, timing is a separate problem. In March 2026, many public forecasts for Bitcoin sit in ranges that look more like $80,000 to $230,000 on price charts, with wider outliers on both sides. Some models and commentators argue for much higher numbers, but $1 million is still commonly placed in the 2030 to 2040 window.
That gap is normal. Adoption tends to move in phases, while price targets often assume the end state arrives quickly. A grounded example of a mid-range target is this Bitcoin $125,000 by end of 2026 view, which reflects the more common "years, not months" pacing.
 ### Adoption usually moves in steps, and big pools of money reallocate slowly
Large institutions do not wake up and move 17% of a portfolio. Committees meet. Mandates constrain. Risk limits apply. Custody policies require approvals, audits, and vendor reviews. Reputational risk also slows action, because a headline mistake can cost careers, especially amid BTC's volatility.
As a result, "slow but steady" often looks like small starter allocations, then gradual increases if the asset behaves well under stress. Access can improve the pace, though. US spot Bitcoin ETFs have made exposure simpler for many investors, and early March 2026 data showed assets under management around the high tens of billions, with flows swinging between inflows and outflows. That pattern suggests interest exists in this cryptocurrency, but it also shows demand is not yet stable, partly due to swings in trading volume on crypto exchanges.
ETFs reduce friction, yet they don't guarantee deep reallocation. They are a bridge, not a verdict.
What could speed it up, and what could stall it out
A balanced view separates plausible accelerators from plausible brakes.
Potential accelerators:
- Falling real yields that make non-yielding store of value assets like BTC more attractive.
- Sustained ETF inflows that signal broad acceptance and improve liquidity.
- More corporate and sovereign adoption that normalizes Bitcoin as a treasury asset on the blockchain.
- Better settlement rails that make large transfers safer and more predictable.
- Clearer regulation that lowers compliance risk for allocators, alongside Bitcoin Core updates bolstering node stability.
Potential brakes:
- Higher rates for longer, which can pull capital back toward bonds and cash.
- Harsh regulation that limits access, custody, or market participation.
- Major crypto exchange or custody failures that reset trust and slow adoption.
- A severe recession that forces selling to raise dollars quickly.
These forces can overlap. A single year can include both, which is why timing calls are fragile.
A clear way to think about the $1 million claim without hype
The $1 million claim for Bitcoin is easiest to evaluate when you treat it like a model, not a prophecy. Models can be useful, but only if you inspect the inputs. When the inputs are hidden, headlines can mislead.
One practical approach is to translate every BTC price claim into four variables: (1) the base asset pool, (2) the assumed share, (3) the supply assumption, and (4) the time horizon. Once you do that, many arguments start to look similar, even when the conclusions feel far apart. Traders using technical analysis often scrutinize these claims through charts and patterns, adding another layer to the evaluation.
The assumption checklist: share, base asset pool, supply, and time horizon
Use this compact checklist when you see a $1 million prediction in the cryptocurrency space:
- Which pool is used? Gold only, or a broader store-of-value pool?
- What share is assumed? Is 17% justified, or just repeated?
- What time period is implied? A near-term call is different from a 10 to 15-year path.
- Is it market cap or price? Headlines blur this often.
- Does it address liquidity, trading volume, and volatility? Large reallocations need deep markets.
- Is demand new, or reallocated? Those are not the same story.
Two models can reach "$1 million" with very different inputs, so always ask what had to be true.
For context on how $1 million claims appear in public commentary, see this example of a high-profile prediction discussed in the press: Trump's $1 million Bitcoin prediction. The point is not the person. It's how easily a number travels without its assumptions.
Risk and reality checks for readers considering exposure
A store of value like Bitcoin can still be a bad fit for your situation. Bitcoin has a long history of sharp drawdowns, sometimes within a single quarter. Position sizing matters because concentration risk can turn a thesis into a forced sale at the worst time. Examples of national adoption, such as El Salvador adopting Bitcoin as legal tender, highlight potential upsides for cryptocurrency, but individual risks remain.
Custody choices also carry trade-offs. Self-custody reduces counterparty risk, but it adds private key management risk. Regulated products on a crypto exchange reduce operational burden, yet they introduce fees, tracking error, and reliance on intermediaries. Taxes can complicate rebalancing too, especially for short holding periods.
Finally, avoid debt-driven bets. Volatility and leverage mix poorly, even when the long-run thesis seems clean. Understanding the model should come first, then deciding whether the risk fits your finances and time horizon.
Conclusion
Bitcoin to $1 million is a store of value reallocation thesis built on market-size math, not a single catalyst. The "17% shift" idea can justify very high BTC USD prices, but only if trust, access improve over years. In March 2026, most 2026 forecasts for BTC remain far below $1 million because cryptocurrency adoption moves in steps and large allocators move slowly. If you want signals that matter, track ETF flows, regulatory clarity, volatility trends, and custody adoption rather than headlines. The numbers can be debated, but the framework stays the same.