3 Reasons Bitcoin Could Start a Multi-Month Uptrend in 2026
Bitcoin isn't in a straight line anymore, and that's the point. After peaking above $126,000 in 2025, BTC has pulled back hard and is now trading around $66,000 to $70,000 in early March 2026.
3 Reasons Bitcoin Could Start a Multi-Month Uptrend in 2026
Bitcoin isn't in a straight line anymore, and that's the point. After peaking above $126,000 in 2025, BTC has pulled back hard and is now trading around $66,000 to $70,000 in early March 2026.
A multi-month uptrend doesn't mean a one-week spike. It usually looks like higher highs and higher lows that keep forming for months, even with scary dips along the way. Think of it like climbing stairs, not riding an elevator.
No one can promise what Bitcoin will do next. Still, three forces in 2026 could be quietly improving the odds that the next sustained move trends up instead of chopping sideways.

Big money is still buying through Bitcoin ETFs, and that can keep dips from turning into crashes
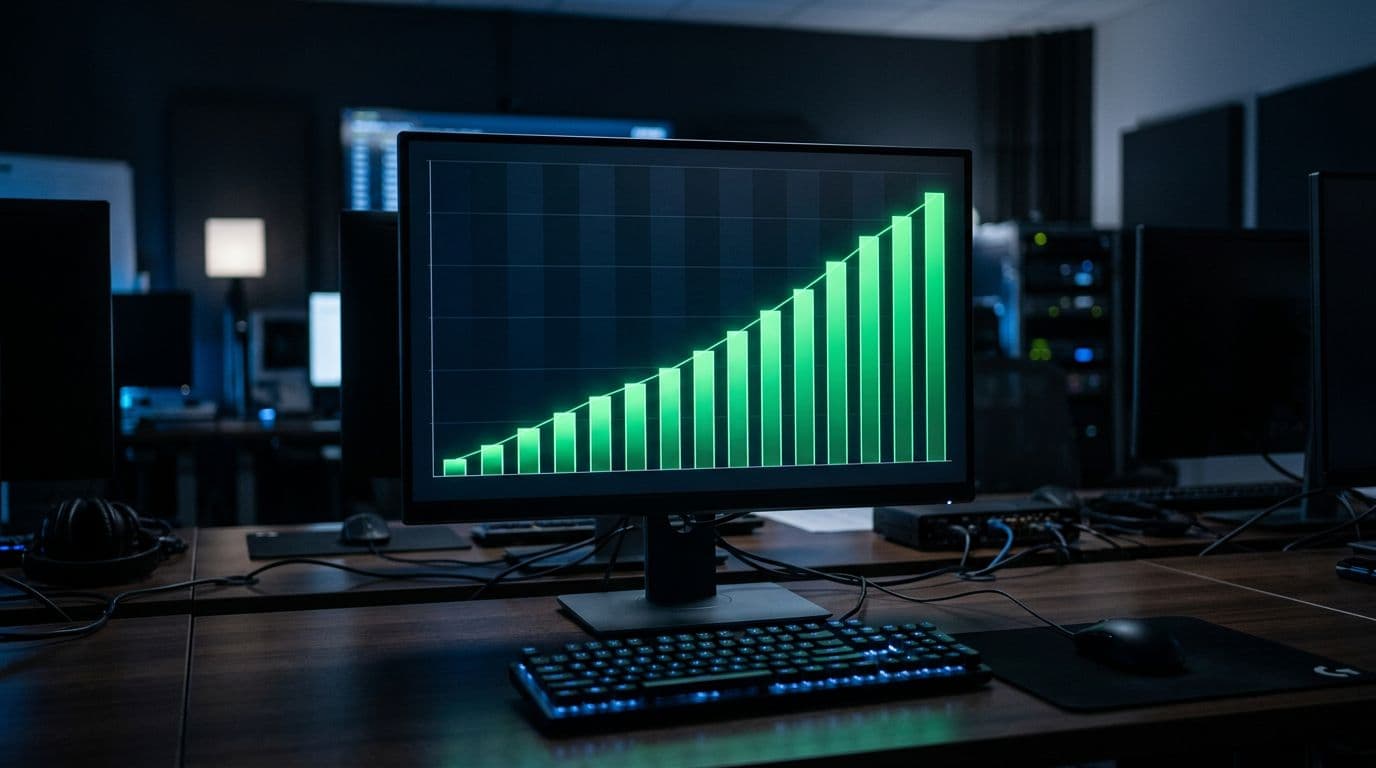 An illustration of steady ETF inflows building over time, created with AI.
Spot Bitcoin ETFs changed who can buy BTC, and how easily they can do it. Large investors that don't want to manage wallets, keys, or crypto exchanges can now get exposure in a familiar wrapper. That matters because slow, steady demand often supports price better than hype-driven retail bursts.
Real-time flow data in early March 2026 shows that demand can return quickly after weak stretches. For example, U.S. spot Bitcoin ETFs posted a strong net inflow day (widely reported at about $458 million on March 2) after weeks of net withdrawals. When inflows show up while price is down from its peak, it's often a sign that bigger players see value, not panic. For context on that recent swing in flows, see this report on one of the quarter's biggest ETF inflow days.
Why ETF demand matters more when supply is tighter after the 2024 halving
Bitcoin's supply grows more slowly after each halving. Since the 2024 halving reduced new coin issuance again, fewer fresh coins come to market each day. Meanwhile, ETFs can concentrate buying pressure into regular market hours, day after day.
The simple idea is supply and demand. If new supply is smaller and new demand is steady, price can react faster when buyers step in. That doesn't guarantee a bull run, because sellers still exist. Long-term holders can take profits, miners still sell some BTC, and macro shocks can hit any time. Still, this setup can make sell-offs shorter if buyers keep absorbing dips.
What to watch in 2026 so you know the ETF story is still bullish
A few practical signs can help you judge whether ETF demand is supporting price:
- Weekly net inflows: More green weeks than red weeks, even if the gains are small.
- Dip response: Sharp drops that get bought within days, not weeks.
- Calmer trading: Lower volatility while price slowly grinds higher.
- Leadership by big funds: Consistent inflows into the largest ETFs, not just smaller products.
If ETF demand stays steady during scary headlines, it can turn "crash risk" into "dip risk," and that changes how trends behave.
The chart is building a base, and key price levels suggest a possible trend shift
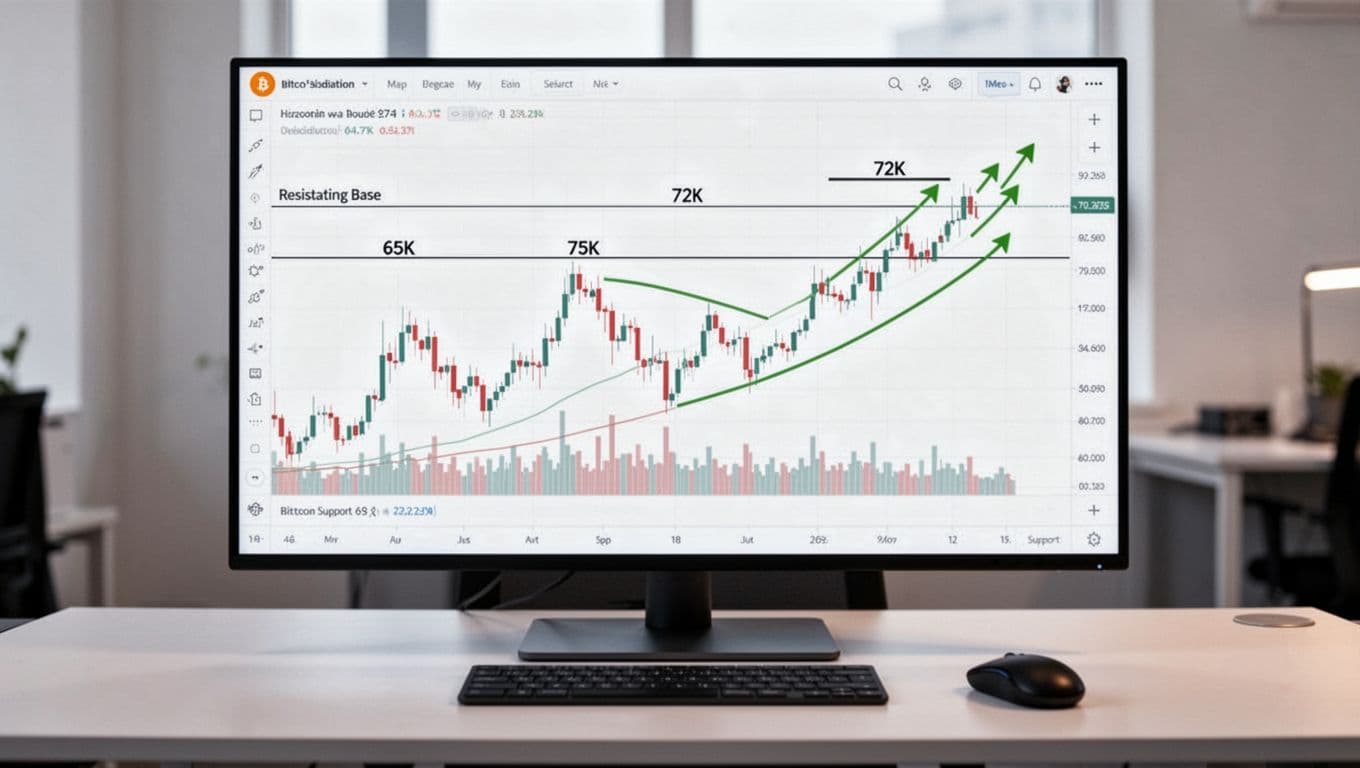 A chart-style view of consolidation and key levels, created with AI.
In March 2026, Bitcoin is holding above roughly $65,000, with many traders watching $60,000 as a major line in the sand. On the upside, the market keeps reacting near the low $70,000s. A commonly watched breakout area is around $72,000, with bullish targets often discussed around $84,000 if momentum returns.
This is where basic chart terms help:
- Support is a price zone where buyers tend to show up.
- Resistance is a zone where sellers tend to show up.
- A base is a stretch where price stops falling and starts building a floor.
When Bitcoin builds a base after a big drop, it can signal that forced selling has faded and patient buyers are taking control. That's not magic. It's just the market catching its breath.
For a snapshot of how traders are framing these levels right now, this Bitcoin technical analysis report (March 2, 2026) covers support and resistance zones in the current range.
A strong floor near $60,000 to $65,000 can attract buyers who missed the last run
Repeated bounces from a similar area can build confidence. Each time price dips and recovers, buyers learn they don't need to wait for "the perfect entry." As a result, they step in sooner, and the lows can rise over time.
The size of the pullback also matters. Dropping close to 50% from the 2025 peak can flush out leverage and cool the mood. That reset can be healthy. In past cycles, the cleanest uptrends often started after the market stopped feeling easy.
What a real breakout could look like (and how to avoid getting faked out)
A breakout is more than one green candle. A cleaner confirmation often looks like:
- A daily or weekly close above roughly $72,000
- Follow-through buying over the next several sessions
- A pullback that holds near the old resistance, which then acts like new support
Fake breakouts happen when price pokes above resistance, triggers excitement, then snaps back down fast. Chasing big green moves can feel good for an hour, then hurt for weeks. Patience is a strategy too.
If rates fall and investors feel braver, Bitcoin usually benefits from that risk-on mood
 A visual metaphor for improving risk appetite, created with AI.
Bitcoin often does better when investors feel comfortable taking risk. In plain terms, when markets are calm and money feels less tight, people tend to buy growth assets. That can include stocks, crypto, and anything with upside potential.
In early 2026, rate expectations are mixed. Some forecasters expect one to two Fed cuts during 2026, while others expect no cuts. The key takeaway is simpler than the debate: financial conditions can shift, and Bitcoin reacts quickly when they do.
How looser financial conditions can push more money into Bitcoin
Lower rates can reduce the "reward" of sitting in cash. At the same time, cheaper borrowing can make investing feel easier across markets. If that mood spreads, Bitcoin may catch a tailwind, especially if ETF flows stay positive.
Still, macro stories can flip fast. Inflation can re-heat, policy can change, and geopolitics can hit sentiment overnight. That's why it helps to track a few signals instead of trusting one narrative.
Signals everyday investors can track without fancy tools
Here are three simple indicators that often reflect risk appetite:
- Major stock indexes: When they trend up, risk-on is usually stronger.
- Credit spreads: This is the gap between safer and riskier bond yields, widening spreads often mean stress.
- Bitcoin's reaction to bad news: If BTC stops dropping on negative headlines, sellers may be running out.
To keep an eye on the broader rate backdrop, the St. Louis Fed's U.S. Treasury yield data is a straightforward reference point.
Conclusion
Bitcoin doesn't need perfect conditions to start a multi-month uptrend in 2026. It needs steady demand (especially via ETFs), a base that holds key support near $60,000 to $65,000, and a market mood that shifts toward risk-on.
A practical next step is to pick two or three signals to watch, such as ETF net flows, a confirmed move above $72,000, and whether broader markets look calmer. If you're investing, consider dollar-cost averaging and set clear risk rules (position size, stop level, and time horizon). Crypto stays volatile, and no single factor guarantees a sustained run, but stacked positives can tilt the odds.